
2024 Maryland Soybean Fungicide Efficacy Trials
Andrew Kness, Senior Agriculture Extension Agent University of Maryland Extension akness@umd.edu
JUSTIFICATION
Fungicides are becoming increasingly popular in full season soybean production. These trials provide data that soybean producers can benefit from, such as: fungicide efficacy for managing common fungal diseases of soybean, monitor fungicide resistant pest populations, and track the economic impact of foliar fungicide applications over multiple years and environments unique to Maryland.
RESEARCH OBJECTIVES
- Evaluate the efficacy of select foliar fungicides on full season soybeans grown on two research farms in Maryland by measuring foliar disease incidence and severity.
- Determine any greening or green stem effects of the fungicides.
- Monitor fungicide active ingredient efficacy over time and
identify any fungicide insensitive foliar fungal pathogens.
- Determine the yield impact of foliar fungicides and their economic impact.
METHODS
Plot Design
Field trials were established at three University of Maryland Research farms: Western Maryland Research & Education Center in Keedysville, MD (WMREC), Wye Research and Education Center in Queenstown, MD (WYE), and Central Maryland Research & Education Center (CMREC). Plots were 11’x30’ arranged in a randomized complete block design with five replicates. Planting details are outlined in Table 1. Plots were established in fields with a previous crop of soybeans to maximize conditions for soybean disease development.
Fertility, insect, and weed management were consistent with University of Maryland Extension recommendations for full-season soybean production.
Project supported by the Maryland Soybean Board
Table 1. Planting and harvest specifications.
| WMREC | CMREC | WYE |
Seed: | --------------------------Soybean, Seed Consultants SC7364E------------------------------ | ||
Previous Crop: | --------------------------------------------Soybean-------------------------------------------- | ||
Tillage | ---------------------------------------------No till--------------------------------------------- | ||
Plant Date: | 6/11/2024 | 5/17/2024 | 6/6/2024 |
Harvest Date: | 11/7/2024 11/8/2024 10/30/2024 | ||
Fungicide Applications
Fungicides (Table 2) were applied at the R3 growth stage (August 5 at WYE and August 15 at WMREC and CMREC) using a CO 2 powered backpack sprayer equipped with TeeJet 8003 nozzles calibrated to deliver 20 GPA at 35 psi to the center 80 inches of each plot.
Table 2. Fungicide treatments.
Treatment | Product Name Active Ingredient(s) | Application Rate (& Timing) |
Non-treated Control | None | N/A |
Veltyma | Veltyma 3.34 SC | 10.0 fl oz/A (R3) |
Priaxor | Priaxor 4.7 SC | 8.0 fl oz/A (R3) |
Lucento | Lucento 4.17 CS | 5.0 fl oz/A (R3) |
Topguard EQ | Topguard EQ 4.29EC | 5.0 fl oz/A (R3) |
Revytek | Revytek 3.33 SC | 15.0 fl oz/A (R3) |
Revylok | Revylok | 6.5 fl oz/A (R3) |
Adastrio | Adastrio 4 SC | 8.0 fl oz/A (R3) |
Disease Rating
Foliar diseases were rated prior to fungicide application at R3 and approximately every two weeks following until approximately R6. Disease severity from frogeye leaf spot (FLS; Cercospora sojina) was visually rated as the percent leaf area infected in the upper canopy from the center rows of each plot (four rows for 15-inch row spacing plots and two rows of the 30-inch row spacing plots). Frogeye leaf spot is typically the most prevalent foliar fungal disease in Maryland soybean production.
Harvest and Statistics
Yield data were collected by harvesting the center 5 feet of each plot using an Almaco R1 research combine. All yields reported are adjusted to 13% moisture. Harvest dates are shown in Table 1. Statistics related to profitability and economics were calculated using the local cash market price for soybean of $9.94 per bushel at the time of analysis. Data were analyzed using ANOVA and significant differences between treatments were separated using Fisher’s Least Significant Difference (LSD; α=0.10).
RESULTS & DISCUSSION
Disease Rating
Growing conditions were generally not favorable for disease development and we did not observe any ratable fungal diseases at any of the three trial locations. This is likely due to the hot, dry weather conditions around pod fill. This is now the fourth year in a row where no ratable foliar diseases were present in these plots..
Yield
Yields (Table 3) were strong across all locations. Average yield at WYE was 93.6, 89.2 at CMREC, and 75.5 bushels per acre at WMREC. Statistically, there were no significant differences between fungicide treatments and the non-treated control at any of the trial locations (p>0.10). There were also no significant differences in grain moisture or test weight.
Table 3. 2024 Harvest Data.
Treatment | WMREC | CMREC | WYE | ||||||
Yield | Moisture | Test Wt. | Yield | Moisture | Test Wt. | Yield | Moisture | Test Wt. | |
Control | 71.3 | 12.7 | 52.4 | 87.6 | 14.7 | 49.7 | 89.7 | 13.1 | 54.4 |
Veltyma | 73.2 | 12.7 | 51.3. | 90.0 | 14.4 | 50.2 | 92.8 | 13.2 | 52.0 |
Priaxor | 74.6 | 12.8 | 50.9 | 84.9 | 14.3 | 49.7 | 92.9 | 13.3 | 55.3 |
Lucento | 79.4 | 12.7 | 52.1 | 91.3 | 14.7 | 52.3 | 93.8 | 13.3 | 52.3 |
Topguard EQ | 75.8 | 12.7 | 52.5 | 83.8 | 14.6 | 50.8 | 91.6 | 13.4 | 51.5 |
Revytek | 77.3 | 12.7 | 53.3 | 91.8 | 14.5 | 49.8 | 96.1 | 13.4 | 53.9 |
Revylok | 77.1 | 12.6 | 51.9 | 91.8 | 14.9 | 50.7 | 100.5 | 13.5 | 53.8 |
Adastrio | 75.2 | 12.6 | 51.2 | 91.8 | 14.5 | 51.0 | 91.2 | 13.5 | 53.2 |
P Value | 0.9324 | 0.8317 | 0.8837 | 0.9107 | 0.7933 | 0.5382 | 0.7355 | 0.2668 | 0.2913 |
Since there was a significant difference in yield between locations (p<0.0001), relative yield was calculated and used to compare yields across locations. Relative yield was calculated by dividing the plot yield by the non- treated control plot yield and reported as a percentage. Values greater than 100 represent a yield greater than the control and values less than 100 represent a yield less than the control. When data were combined this way, no significant differences were observed between treatments (p=0.3688, Figure 1).
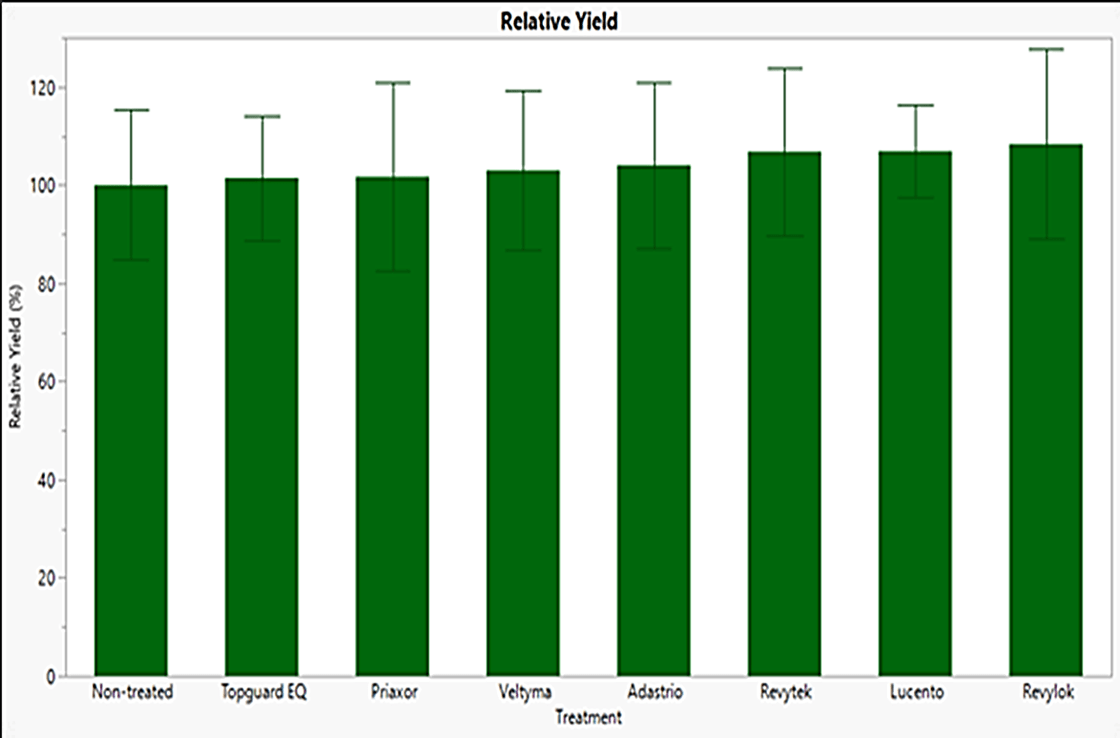
Figure 1. Relative grain yield of all 2024 site locations combined. Each error bar is constructed using 1 standard deviation from the mean. No significant differences between treatments (α=0.10).
Green Stem
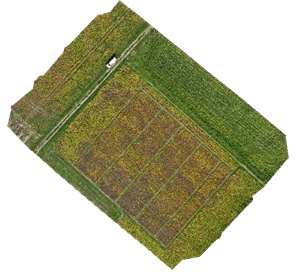
It is common for fungicides to keep plants greener for longer, and we observed a significant difference in plant greenness prior to harvest in plots that received a fungicide application (p=0.0019). Revytek, Revtylok, and Veltyma had the highest green stem scores, with the non-treated control the lowest. Treatments similar to the control were Lucento and Adastrio.
Figure 2. Aerial image of plots showing different levels of green stem (green canopy).
CONCLUSIONS, IMPLICATIONS, AND FUTURE WORK
In previous years of this study, foliar fungicide applications with the selected products tested provided some
benefit related to improved seed quality and yield in situations where FLS disease pressure was present at measurable levels (2018-2019). Fungicides also significantly increased plant greenness and delayed senescence in all years tested.
During the 2024 growing season, none of the treatments tested yielded significantly different than the non- treated control. This is likely due to the fact that no ratable foliar fungal diseases were present in the plots this year. Without the presence of a pathogen, fungicides have reduced odds of improving yields over non- treated plots.
Relative net profit was calculated by multiplying the bushel increase over the non-treated control by the cash market price for soybean at the time of analysis ($9.94/bu for December 2024) and subtracting the cost of application. A flat rate of $25.00 per acre was used for 2024 data; for plots with two applications, $50.00 was used. This metric, net profit, was used to compare the economics of the fungicides while accounting for yield, market prices, and the cost of application. Figure 3 shows net profit for each treatment in 2024; there are no significant differences due to a high degree of variability in the data (p=0.9555).
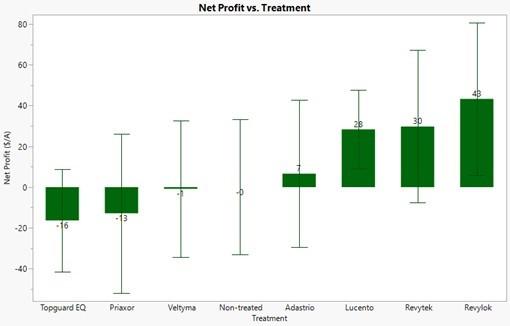
Figure 3. Net profit of 2024 fungicide treatments. Each error bar is constructed using 1 standard deviation from the mean. No significant differences between treatments (α=0.10).
When net profit was analyzed by treatment timing (R3, R3 + 14, and none) across all years (2021-2024), the single R3 application provided a significantly greater profit margin ($17/acre) than two treatment program (-$22/acre), but similar to the non-treated control (p=0.0981; Figure 4). These data indicate no fungicide application or a single fungicide application at R3 provides the greatest profit margin compared to a two-pass program.
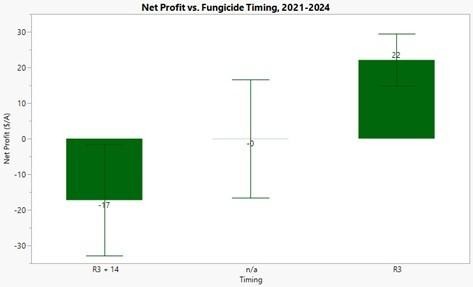
Figure 4. Net profit by fungicide timing of 2021-2024. Each error bar is constructed using 1 standard error from the mean. Treatment timings connected by the same letter are not significantly different (α=0.10).
Future work will be focused on replicating similar experiments over more site-years to gather more data for Maryland’s unique growing conditions and to track pathogen resistance and fungicide profitability over time. Work will also focus on testing new and emerging fungicide products from various chemical companies to evaluate their performance.
ACKNOWLEDGEMENTS
This work is supported by grant funding through the Maryland Soybean Board and in-kind support from BASF, Bayer, Corteva, FMC, and Syngenta. Special thanks to the Maryland Agriculture Experiment Station and research farm crew at the Western Maryland Research & Education Center, Central Maryland Research & Education Center, and the Wye Research and Education Center for making this research possible.
APPENDIX
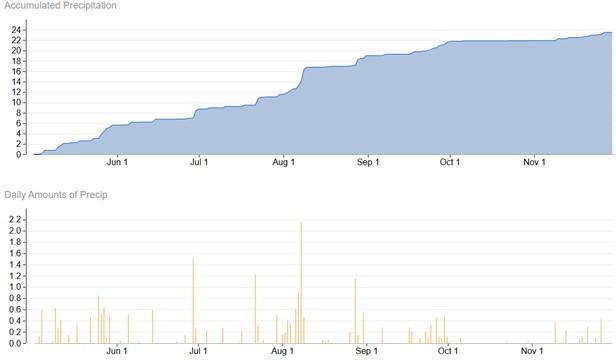
Precipitation WMREC (May 1-November 30, 2024)
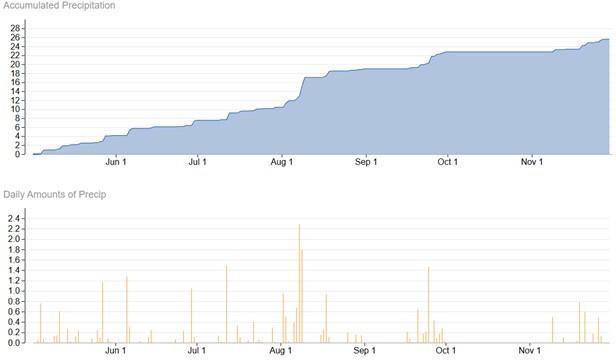
Precipitation CMREC (May 1-November 30, 2024)
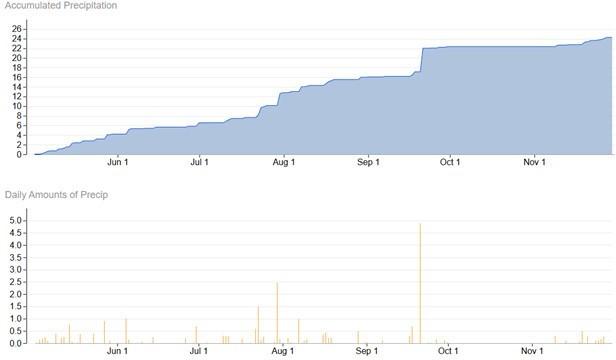
Precipitation WYE (May 1-November 30, 2024)
Back to Roots in Research WMREC